


Page 40 - Demo
P. 40
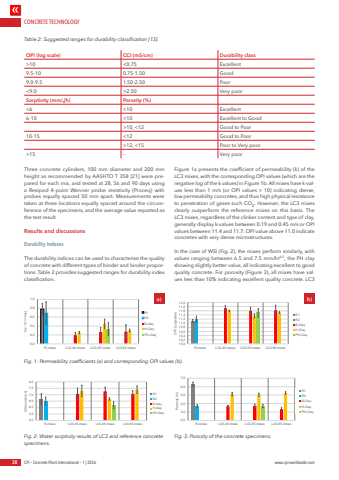
CONCRETE TECHNOLOGY38 CPI %u2013 Concrete Plant International %u2013 1 | 2026 www.cpi-worldwide.comThree concrete cylinders, 100 mm diameter and 200 mm height as recommended by AASHTO T 358 [21] were prepared for each mix, and tested at 28, 56 and 90 days using a Resipod 4-point Wenner probe resistivity (Proceq) with probes equally spaced 50 mm apart. Measurements were taken at three locations equally spaced around the circumference of the specimens, and the average value reported as the test result. Results and discussions Durability IndexesThe durability indices can be used to characterise the quality of concrete with different types of binder and binder proportions. Table 2 provides suggested ranges for durability index classification.Figure 1a presents the coefficient of permeability (k) of the LC3 mixes, with the corresponding OPI values (which are the negative log of the k values) in Figure 1b. All mixes have k-values less than 1 m/s (or OPI values > 10) indicating dense, low permeability concretes, and thus high physical resistance to penetration of gases such CO2. However, the LC3 mixes clearly outperform the reference mixes on this basis. The LC3 mixes, regardless of the clinker content and type of clay, generally display k-values between 0.19 and 0.45 m/s or OPI values between 11.4 and 11.7. OPI value above 11.0 indicate concretes with very dense microstructures. In the case of WSI (Fig. 2), the mixes perform similarly, with values ranging between 6.5 and 7.5 mm/hr0.5, the PH clay showing slightly better value, all indicating excellent to good quality concrete. For porosity (Figure 3), all mixes have values less than 10% indicating excellent quality concrete. LC3 Table 2: Suggested ranges for durability classification [13].OPI (log scale) CCI (mS/cm) Durability class>10 <0.75 Excellent9.5-10 0.75-1.50 Good9.0-9.5 1.50-2.50 Poor<9.0 >2.50 Very poorSorptivity (mm/%u221ah) Porosity (%)<6 <10 Excellent6-10 <10 Excellent to Good>10, <12 Good to Poor10-15 <12 Good to Poor>12, <15 Poor to Very poor>15 %u2013 Very poor0,00,20,40,60,81,0R-mixes LC3-45 mixes LC3-55 mixes LC3-65 mixesk (x 10-11 m/s)R1R2B-ClayH-ClayPH-Clay10,010,210,410,610,811,011,211,411,611,812,0R-mixes LC3-45 mixes LC3-55 mixes LC3-65 mixesOPI (Log scale)R1R2B-ClayH-ClayPH-Clay0,00,20,40,60,81,0R-mixes LC3-45 mixes LC3-55 mixes LC3-65 mixesk (x 10-11 m/s)R1R2B-ClayH-ClayPH-Clay10,010,210,410,610,811,011,211,411,611,812,0R-mixes LC3-45 mixes LC3-55 mixes LC3-65 mixesOPI (Log scale)R1R2B-ClayH-ClayPH-Clay5,05,56,06,57,07,58,0R-mixes LC3-45 mixes LC3-55 mixes LC3-65 mixesWSI (mm/hr0.5)R1R2B-ClayH-ClayPH-Clay2,03,04,05,06,07,0R-mixes LC3-45 mixes LC3-55 mixes LC3-65 mixesPorosity (%)R1R2B-ClayH-ClayPH-ClayFig. 1: Permeability coefficients (a) and corresponding OPI values (b).Fig. 2: Water sorptivity results of LC3 and reference concrete specimens.Fig. 3: Porosity of the concrete specimens.a) b)


