
Page 34 - Demo
P. 34
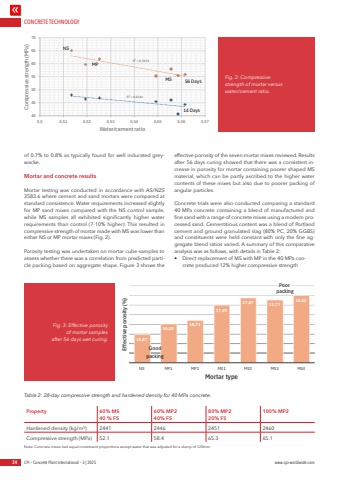
CONCRETE TECHNOLOGY34 CPI %u2013 Concrete Plant International %u2013 3 | 2025 www.cpi-worldwide.comof 0.7% to 0.8% as typically found for well indurated greywacke. Mortar and concrete resultsMortar testing was conducted in accordance with AS/NZS 3583.6 where cement and sand mortars were compared at standard consistence. Water requirements increased slightly for MP sand mixes compared with the NS control sample, while MS samples all exhibited significantly higher water requirements than control (7-10% higher). This resulted in compressive strength of mortar made with MS was lower than either NS or MP mortar mixes (Fig. 2).Porosity testing was undertaken on mortar cube samples to assess whether there was a correlation from predicted particle packing based on aggregate shape. Figure 3 shows the effective porosity of the seven mortar mixes reviewed. Results after 56 days curing showed that there was a consistent increase in porosity for mortar containing poorer shaped MS material, which can be partly ascribed to the higher water contents of these mixes but also due to poorer packing of angular particles.Concrete trials were also conducted comparing a standard 40 MPa concrete containing a blend of manufactured and fine sand with a range of concrete mixes using a modern processed sand. Cementitious content was a blend of Portland cement and ground granulated slag (80% PC, 20% GGBS) and constituents were held constant with only the fine aggregate blend ratios varied. A summary of this comparative analysis was as follows, with details in Table 2:%u2022 Direct replacement of MS with MP in the 40 MPa concrete produced 12% higher compressive strengthMortar trials using AS/NZS 3583Water/cement versus compressive strength Density versus compressive strength0,5135 0,5255 0,5195 0,5495 0,5616 0,5556 0,5586 2228 2276 2254 2260 214D fc 47,8 46,7 46,4 45,4 44,3 45,9 40,5 14D fc 47,8 46,7 46,4 45,4 456D fc 65,1 61,6 59,6 55,2 55,7 57,9 55,4 28D Pred.R%u00b2 = 0,5244R%u00b2 = 0,7859404550556065700,5 0,51 0,52 0,53 0,54 0,55 0,56 0,57Compressive strength (MPa)Water/cement ratioNSMPMS 56 Days14 Days15,9716,52 16,7117,4917,87 17,7718,00NS MP1 MP2 MS1 MS2 MS3 MS4Effective porosity (%)Mortar typeGoodpackingPoorpackingFig. 2: Compressive strength of mortar versus water/cement ratio.Fig. 3: Effective porosity of mortar samples after 56 days wet curing.Table 2: 28-day compressive strength and hardened density for 40 MPa concrete.Property 60% MS40 % FS60% MP240% FS80% MP220% FS100% MP2Hardened density (kg/m%u00b3) 2441 2446 2451 2460Compressive strength (MPa) 52.1 58.4 65.3 65.1Note: Concrete mixes had equal constituent proportions except water that was adjusted for a slump of 120mm
