
Page 56 - Demo
P. 56
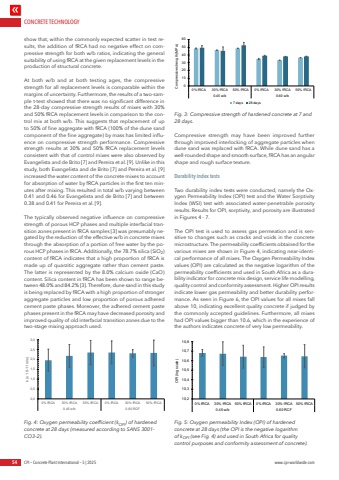
CONCRETE TECHNOLOGY54 CPI %u2013 Concrete Plant International %u2013 5 | 2025 www.cpi-worldwide.comshow that, within the commonly expected scatter in test results, the addition of fRCA had no negative effect on compressive strength for both w/b ratios, indicating the general suitability of using fRCA at the given replacement levels in the production of structural concrete. At both w/b and at both testing ages, the compressive strength for all replacement levels is comparable within the margins of uncertainty. Furthermore, the results of a two-sample t-test showed that there was no significant difference in the 28-day compressive strength results of mixes with 30% and 50% fRCA replacement levels in comparison to the control mix at both w/b. This suggests that replacement of up to 50% of fine aggregate with fRCA (100% of the dune sand component of the fine aggregate) by mass has limited influence on compressive strength performance. Compressive strength results at 30% and 50% fRCA replacement levels consistent with that of control mixes were also observed by Evangelista and de Brito [7] and Pereira et al. [9]. Unlike in this study, both Evangelista and de Brito [7] and Pereira et al. [9] increased the water content of the concrete mixes to account for absorption of water by fRCA particles in the first ten minutes after mixing. This resulted in total w/b varying between 0.41 and 0.46 for Evangelista and de Brito [7] and between 0.38 and 0.41 for Pereira et al. [9]. The typically observed negative influence on compressive strength of porous HCP phases and multiple interfacial transition zones present in fRCA samples [3] was presumably negated by the reduction of the effective w/b in concrete mixes through the absorption of a portion of free water by the porous HCP phases in fRCA. Additionally, the 78.7% silica (SiO2) content of fRCA indicates that a high proportion of fRCA is made up of quarzitic aggregate rather than cement paste. The latter is represented by the 8.0% calcium oxide (CaO) content. Silica content in fRCA has been shown to range between 48.0% and 84.2% [3]. Therefore, dune sand in this study is being replaced by fRCA with a high proportion of stronger aggregate particles and low proportion of porous adhered cement paste phases. Moreover, the adhered cement paste phases present in the fRCA may have decreased porosity and improved quality of old interfacial transition zones due to the two-stage mixing approach used. Compressive strength may have been improved further through improved interlocking of aggregate particles when dune sand was replaced with fRCA. While dune sand has a well-rounded shape and smooth surface, fRCA has an angular shape and rough surface texture. Durability index testsTwo durability index tests were conducted, namely the Oxygen Permeability Index (OPI) test and the Water Sorptivity Index (WSI) test with associated water-penetrable porosity results. Results for OPI, sorptivity, and porosity are illustrated in Figures 4 - 7. The OPI test is used to assess gas permeation and is sensitive to changes such as cracks and voids in the concrete microstructure. The permeability coefficients obtained for the various mixes are shown in Figure 4, indicating near-identical performance of all mixes. The Oxygen Permeability Index values (OPI) are calculated as the negative logarithm of the permeability coefficients and used in South Africa as a durability indicator for concrete mix design, service life modelling, quality control and conformity assessment. Higher OPI results indicate lower gas permeability and better durability performance. As seen in Figure 6, the OPI values for all mixes fall above 10, indicating excellent quality concrete if judged by the commonly accepted guidelines. Furthermore, all mixes had OPI values bigger than 10.6, which in the experience of the authors indicates concrete of very low permeability. fifffifflfiffififlfi%u001afi%u0019fifi%u0018%u0017%u0016%u0015%u0014%u0013 ffifi%u0018%u0017%u0016%u0015%u0014%u0013 %u001afi%u0018%u0017%u0016%u0015%u0014%u0013 fi%u0018%u0017%u0016%u0015%u0014%u0013 ffifi%u0018%u0017%u0016%u0015%u0014%u0013 %u001afi%u0018%u0017%u0016%u0015%u0014%u0013fi%u0012fl%u001a%u0017%u0011%u0010%u000f fi%u0012%u0019fi%u0017%u0011%u0010%u000f%u0014%u000e%u000c%u000b%u0009%u0009%u0008%u0007%u0017%u0009%u0006%u000b%u0005%u0004%u0006%u0003%u0017%u0001%u0081%u008d%u008f%u0017%u0090%u0081%u009d%u0009 ffl%u00a0%u0017%u0090%u0081%u009d%u00090,00,51,01,52,02,53,00% fRCA 30% fRCA 50% fRCA 0% fRCA 30% fRCA 50% fRCA0.45 w/b 0.60 RCFk (x 10-11 m/s)fifffflffififffflflfiffffl%u001afiffffl%u0019fiffffl%u0018fiffffl%u0017fiffffl%u0016ff%u0015%u0014%u0013%u0012%u0011%u0010 flff%u0015%u0014%u0013%u0012%u0011%u0010 %u0019ff%u0015%u0014%u0013%u0012%u0011%u0010 ff%u0015%u0014%u0013%u0012%u0011%u0010 flff%u0015%u0014%u0013%u0012%u0011%u0010 %u0019ff%u0015%u0014%u0013%u0012%u0011%u0010ff%u000f%u001a%u0019%u0014%u000e%u000c ff%u000f%u0018ff%u0014%u0012%u0011%u000b%u0009%u0008%u0014%u0007%u0006%u0005%u0004%u0014%u0003%u0001%u0006%u0081Fig. 3: Compressive strength of hardened concrete at 7 and 28 days. Fig. 4: Oxygen permeability coefficient (kOPI) of hardened concrete at 28 days (measured according to SANS 3001-CO3-2).Fig. 5: Oxygen permeability Index (OPI) of hardened concrete at 28 days (the OPI is the negative logarithm of kOPI (see Fig. 4) and used in South Africa for quality control purposes and conformity assessment of concrete).
