
Page 54 - Demo
P. 54
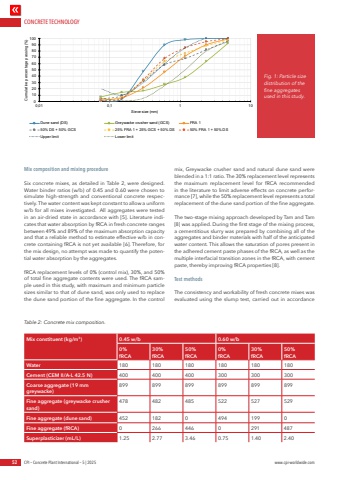
CONCRETE TECHNOLOGY52 CPI %u2013 Concrete Plant International %u2013 5 | 2025 www.cpi-worldwide.comMix composition and mixing procedureSix concrete mixes, as detailed in Table 2, were designed. Water binder ratios (w/b) of 0.45 and 0.60 were chosen to simulate high-strength and conventional concrete respectively. The water content was kept constant to allow a uniform w/b for all mixes investigated. All aggregates were tested in an air-dried state in accordance with [5]. Literature indicates that water absorption by fRCA in fresh concrete ranges between 49% and 89% of the maximum absorption capacity and that a reliable method to estimate effective w/b in concrete containing fRCA is not yet available [6]. Therefore, for the mix design, no attempt was made to quantify the potential water absorption by the aggregates.fRCA replacement levels of 0% (control mix), 30%, and 50% of total fine aggregate contents were used. The fRCA sample used in this study, with maximum and minimum particle sizes similar to that of dune sand, was only used to replace the dune sand portion of the fine aggregate. In the control mix, Greywacke crusher sand and natural dune sand were blended in a 1:1 ratio. The 30% replacement level represents the maximum replacement level for fRCA recommended in the literature to limit adverse effects on concrete performance [7], while the 50% replacement level represents a total replacement of the dune sand portion of the fine aggregate. The two-stage mixing approach developed by Tam and Tam [8] was applied. During the first stage of the mixing process, a cementitious slurry was prepared by combining all of the aggregates and binder materials with half of the anticipated water content. This allows the saturation of pores present in the adhered cement paste phases of the fRCA, as well as the multiple interfacial transition zones in the fRCA, with cement paste, thereby improving fRCA properties [8]. Test methodsThe consistency and workability of fresh concrete mixes was evaluated using the slump test, carried out in accordance fifffifflfiffififlfi%u001afi%u0019fi%u0018fi%u0017fi%u0016fifffififi%u0015fiff fi%u0015ff ff fffi%u0014%u0013%u0012%u0013%u0011%u0010%u000f%u000e%u000c%u000b%u000c%u0009%u0008%u000c%u0007%u000f%u0010%u0006%u000c%u000b%u0010%u0005%u0005%u000e%u0007%u0006%u000b%u0004%u0003%u0001%u000e%u000c%u000c%u000b%u0005%u000e%u000c%u000b%u0004%u0012%u0012%u0081%u0013%u0007%u000c%u000b%u0005%u0010%u0007%u008d%u000b%u0004%u0081%u0001 %u008f%u0009%u000c%u0090%u009d%u0010%u0008%u00a0%u000c%u000b%u0008%u0009%u0013%u0005%u00ad%u000c%u0009%u000b%u0005%u0010%u0007%u008d%u000b%u0004%u008f%u0014%u0001 %u0080%u0082%u0083%u000bff%u001afi%u0003%u000b%u0081%u0001%u000b%u0084%u000b%u001afi%u0003%u000b%u008f%u0014%u0001 ffl%u001a%u0003%u000b%u0080%u0082%u0083%u000bff%u000b%u0084%u000bffl%u001a%u0003%u000b%u008f%u0014%u0001%u000b%u0084%u000b%u001afi%u0003%u000b%u0081%u0001 %u001afi%u0003%u000b%u0080%u0082%u0083%u000bff%u000b%u0084%u000b%u001afi%u0003%u000b%u0081%u0001%u0085%u000c%u0009%u000b%u0011%u000e%u0012%u000e%u000f %u0086%u0087%u009d%u000c%u0009%u000b%u0011%u000e%u0012%u000e%u000fFig. 1: Particle size distribution of the fine aggregates used in this study.Table 2: Concrete mix composition. Mix constituent (kg/m3) 0.45 w/b 0.60 w/b0%fRCA30% fRCA50%fRCA0%fRCA30%fRCA50%fRCAWater 180 180 180 180 180 180Cement (CEM II/A-L 42.5 N) 400 400 400 300 300 300Coarse aggregate (19 mm greywacke)899 899 899 899 899 899Fine aggregate (greywacke crusher sand)478 482 485 522 527 529Fine aggregate (dune sand) 452 182 0 494 199 0Fine aggregate (fRCA) 0 266 446 0 291 487Superplasticizer (mL/L) 1.25 2.77 3.46 0.75 1.40 2.40
