
Page 20 - Demo
P. 20
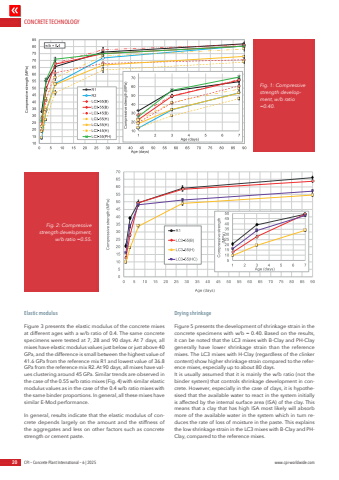
CONCRETE TECHNOLOGY20 CPI %u2013 Concrete Plant International %u2013 6 | 2025 www.cpi-worldwide.comElastic modulusFigure 3 presents the elastic modulus of the concrete mixes at different ages with a w/b ratio of 0.4. The same concrete specimens were tested at 7, 28 and 90 days. At 7 days, all mixes have elastic modulus values just below or just above 40 GPa, and the difference is small between the highest value of 41.6 GPa from the reference mix R1 and lowest value of 36.8 GPa from the reference mix R2. At 90 days, all mixes have values clustering around 45 GPa. Similar trends are observed in the case of the 0.55 w/b ratio mixes (Fig. 4) with similar elastic modulus values as in the case of the 0.4 w/b ratio mixes with the same binder proportions. In general, all these mixes have similar E-Mod performance. In general, results indicate that the elastic modulus of concrete depends largely on the amount and the stiffness of the aggregates and less on other factors such as concrete strength or cement paste. Drying shrinkage Figure 5 presents the development of shrinkage strain in the concrete specimens with w/b = 0.40. Based on the results, it can be noted that the LC3 mixes with B-Clay and PH-Clay generally have lower shrinkage strain than the reference mixes. The LC3 mixes with H-Clay (regardless of the clinker content) show higher shrinkage strain compared to the reference mixes, especially up to about 80 days.It is usually assumed that it is mainly the w/b ratio (not the binder system) that controls shrinkage development in concrete. However, especially in the case of clays, it is hypothesised that the available water to react in the system initially is affected by the internal surface area (ISA) of the clay. This means that a clay that has high ISA most likely will absorb more of the available water in the system which in turn reduces the rate of loss of moisture in the paste. This explains the low shrinkage strain in the LC3 mixes with B-Clay and PHClay, compared to the reference mixes. Fig. 1: Compressive strength development, w/b ratio =0.40. Fig. 2: Compressive strength development, w/b ratio =0.55.
