
Page 22 - Demo
P. 22
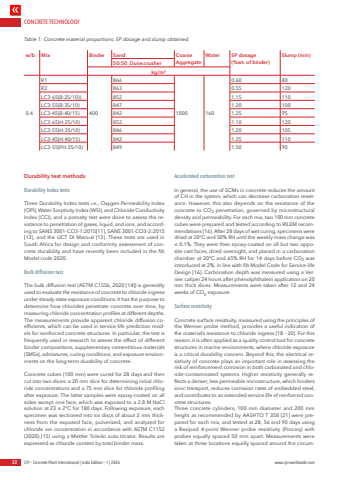
CONCRETE TECHNOLOGY22 CPI %u2013 Concrete Plant International | India Edition %u2013 1 | 2026 www.cpi-worldwide.comDurability test methodsDurability Index testsThree Durability Index tests i.e., Oxygen Permeability Index (OPI), Water Sorptivity Index (WSI), and Chloride Conductivity Index (CCI), and a porosity test were done to assess the resistance to penetration of gases, liquid, and ions, and according to SANS 3001-CO3-1:2015[11], SANS 3001-CO3-2:2015 [12], and the UCT DI Manual [13]. These tests are used in South Africa for design and conformity assessment of concrete durability and have recently been included in the fibModel code 2020. Bulk diffusion testThe bulk diffusion test (ASTM C1556, 2020 [14]) is generally used to evaluate the resistance of concrete to chloride ingress under steady-state exposure conditions. It has the purpose to determine how chlorides penetrate concrete over time, by measuring chloride concentration profiles at different depths. The measurements provide apparent chloride diffusion coefficients, which can be used in service-life prediction models for reinforced concrete structures. In particular, the test is frequently used in research to assess the effect of different binder compositions, supplementary cementitious materials (SMSs), admixtures, curing conditions, and exposure environments on the long-term durability of concrete.Concrete cubes (100 mm) were cured for 28 days and then cut into two slices: a 20 mm slice for determining initial chloride concentrations and a 75 mm slice for chloride profiling after exposure. The latter samples were epoxy-coated on all sides except one face, which was exposed to a 2.8 M NaCl solution at 23 %u00b1 2%u00b0C for 180 days. Following exposure, each specimen was sectioned into six discs of about 2 mm thickness from the exposed face, pulverized, and analyzed for chloride ion concentration in accordance with ASTM C1152 (2020) [15] using a Mettler Toledo auto titrator. Results are expressed as chloride content by total binder mass.Accelerated carbonation testIn general, the use of SCMs in concrete reduces the amount of CH in the system, which can decrease carbonation resistance. However, this also depends on the resistance of the concrete to CO2 penetration, governed by microstructural density and permeability. For each mix, two 100 mm concrete cubes were prepared and tested according to RILEM recommendations [16]. After 28 days of wet curing, specimens were dried at 20%u00b0C and 50% RH until the weekly mass change was %u2264 0.1%. They were then epoxy-coated on all but two opposite cast faces, dried overnight, and placed in a carbonation chamber at 20%u00b0C and 65% RH for 14 days before CO2 was introduced at 2%, in line with fib Model Code for Service-life Design [16]. Carbonation depth was measured using a Vernier caliper 24 hours after phenolphthalein application on 20 mm thick slices. Measurements were taken after 12 and 24 weeks of CO2 exposure.Surface resistivityConcrete surface resistivity, measured using the principles of the Wenner probe method, provides a useful indication of the material%u2019s resistance to chloride ingress [18 %u2013 20]. For this reason, it is often applied as a quality control tool for concrete structures in marine environments, where chloride exposure is a critical durability concern. Beyond this, the electrical resistivity of concrete plays an important role in assessing the risk of reinforcement corrosion in both carbonated and chloride-contaminated systems. Higher resistivity generally reflects a denser, less permeable microstructure, which hinders ionic transport, reduces corrosion rates of embedded steel, and contributes to an extended service life of reinforced concrete structures.Three concrete cylinders, 100 mm diameter and 200 mm height as recommended by AASHTO T 358 [21] were prepared for each mix, and tested at 28, 56 and 90 days using a Resipod 4-point Wenner probe resistivity (Proceq) with probes equally spaced 50 mm apart. Measurements were taken at three locations equally spaced around the circumTable 1: Concrete material proportions, SP dosage and slump obtained.w/b Mix Binder Sand Coarse AggregateWater SP dosage(%wt. of binder)Slump (mm)50:50 Dune:crusherkg/m%u00b30.4R14008661000 1600.60 80R2 863 0.55 120LC3-65(B:25/10)) 852 1.15 110LC3-55(B:35/10) 847 1.20 100LC3-45(B:40/15) 842 1.25 95LC3-65(H:25/10) 852 1.10 120LC3-55(H:35/10) 846 1.20 105LC3-45(H:40/15) 842 1.25 110LC3-55(PH:35/10) 849 1.50 90
