
Page 26 - Demo
P. 26
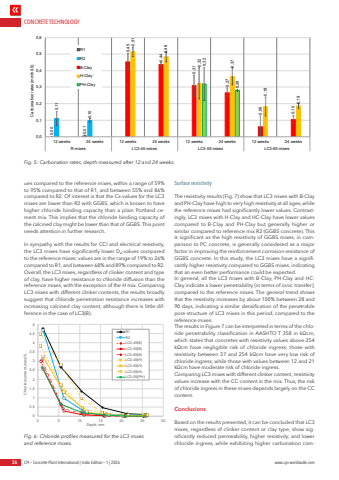
CONCRETE TECHNOLOGY26 CPI %u2013 Concrete Plant International | India Edition %u2013 1 | 2026 www.cpi-worldwide.comues compared to the reference mixes, within a range of 59% to 95% compared to that of R1, and between 55% and 86% compared to R2. Of interest is that the Cs-values for the LC3 mixes are lower than R2 with GGBS, which is known to have higher chloride binding capacity than a plain Portland cement mix. This implies that the chloride binding capacity of the calcined clay might be lower than that of GGBS. This point needs attention in further research. In sympathy with the results for CCI and electrical resistivity, the LC3 mixes have significantly lower Da-values compared to the reference mixes: values are in the range of 19% to 26% compared to R1, and between 68% and 89% compared to R2. Overall, the LC3 mixes, regardless of clinker content and type of clay, have higher resistance to chloride diffusion than the reference mixes, with the exception of the H mix. Comparing LC3 mixes with different clinker contents, the results broadly suggest that chloride penetration resistance increases with increasing calcined clay content, although there is little difference in the case of LC3(B). Surface resistivityThe resistivity results (Fig. 7) show that LC3 mixes with B-Clay and PH-Clay have high to very high resistivity at all ages, while the reference mixes had significantly lower values. Contrastingly, LC3 mixes with H-Clay and HC-Clay have lower values compared to B-Clay and PH-Clay but generally higher or similar compared to reference mix R2 (GGBS concrete). This is significant as the high resistivity of GGBS mixes, in comparison to PC concrete, is generally considered as a major factor in improving the reinforcement corrosion resistance of GGBS concrete. In this study, the LC3 mixes have a significantly higher resistivity compared to GGBS mixes, indicating that an even better performance could be expected. In general, all the LC3 mixes with B-Clay, PH-Clay and HCClay indicate a lower penetrability (in terms of ionic transfer), compared to the reference mixes. The general trend shows that the resistivity increases by about 100% between 28 and 90 days, indicating a similar densification of the penetrable pore structure of LC3 mixes in this period, compared to the reference mixes. The results in Figure 7 can be interpreted in terms of the chloride penetrability classification in AASHTO T 358 in k%u03a9cm, which states that concretes with resistivity values above 254 k%u03a9cm have negligible risk of chloride ingress; those with resistivity between 37 and 254 k%u03a9cm have very low risk of chloride ingress; while those with values between 12 and 21 k%u03a9cm have moderate risk of chloride ingress. Comparing LC3 mixes with different clinker content, resistivity values increase with the CC content in the mix. Thus, the risk of chloride ingress in these mixes depends largely on the CC content.ConclusionsBased on the results presented, it can be concluded that LC3 mixes, regardless of clinker content or clay type, show significantly reduced permeability, higher resistivity, and lower chloride ingress, while exhibiting higher carbonation com0,00 0,01 0,110,100,450,440,310,270,06 0,100,51 0,480,32 0,370,180,190,320,280,00,10,20,30,40,50,612 weeks 24 weeks 12 weeks 24 weeks 12 weeks 24 weeks 12 weeks 24 weeksR-mixes LC3-45 mixes LC3-55 mixes LC3-65 mixesCarbonation rates (mm/h0.5)R1R2B-ClayH-ClayPH-ClayFig. 5: Carbonation rates, depth measured after 12 and 24 weeks.00,511,522,533,544,550 5 10 15 20 25 30Chloride content, mass%Depth, mmR1R2LC3-45(B)LC3-55(B)LC3-65(B)LC3-45(H)LC3-55(H)LC3-65(H)LC3-55(PH)Fig. 6: Chloride profiles measured for the LC3 mixes and reference mixes.
