
Page 24 - Demo
P. 24
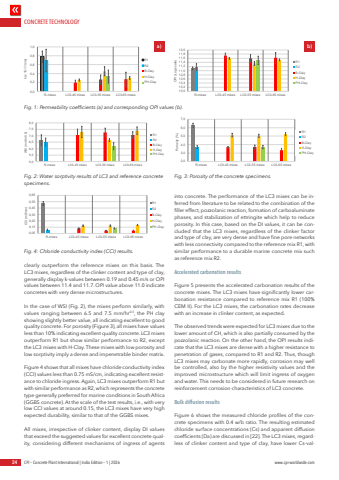
CONCRETE TECHNOLOGY24 CPI %u2013 Concrete Plant International | India Edition %u2013 1 | 2026 www.cpi-worldwide.comclearly outperform the reference mixes on this basis. The LC3 mixes, regardless of the clinker content and type of clay, generally display k-values between 0.19 and 0.45 m/s or OPI values between 11.4 and 11.7. OPI value above 11.0 indicate concretes with very dense microstructures. In the case of WSI (Fig. 2), the mixes perform similarly, with values ranging between 6.5 and 7.5 mm/hr0.5, the PH clay showing slightly better value, all indicating excellent to good quality concrete. For porosity (Figure 3), all mixes have values less than 10% indicating excellent quality concrete. LC3 mixes outperform R1 but show similar performance to R2, except the LC3 mixes with H-Clay. These mixes with low porosity and low sorptivity imply a dense and impenetrable binder matrix. Figure 4 shows that all mixes have chloride conductivity index (CCI) values less than 0.75 mS/cm, indicating excellent resistance to chloride ingress. Again, LC3 mixes outperform R1 but with similar performance as R2, which represents the concrete type generally preferred for marine conditions in South Africa (GGBS concrete). At the scale of the test results, i.e., with very low CCI values at around 0.15, the LC3 mixes have very high expected durability, similar to that of the GGBS mixes. All mixes, irrespective of clinker content, display DI values that exceed the suggested values for excellent concrete quality, considering different mechanisms of ingress of agents into concrete. The performance of the LC3 mixes can be inferred from literature to be related to the combination of the filler effect, pozzolanic reaction, formation of carboaluminate phases, and stabilization of ettringite which help to reduce porosity. In this case, based on the DI values, it can be concluded that the LC3 mixes, regardless of the clinker factor and type of clay, are very dense and have fine pore networks with less connectivity compared to the reference mix R1, with similar performance to a durable marine concrete mix such as reference mix R2. Accelerated carbonation resultsFigure 5 presents the accelerated carbonation results of the concrete mixes. The LC3 mixes have significantly lower carbonation resistance compared to reference mix R1 (100% CEM II). For the LC3 mixes, the carbonation rates decrease with an increase in clinker content, as expected. The observed trends were expected for LC3 mixes due to the lower amount of CH, which is also partially consumed by the pozzolanic reaction. On the other hand, the OPI results indicate that the LC3 mixes are dense with a higher resistance to penetration of gases, compared to R1 and R2. Thus, though LC3 mixes may carbonate more rapidly, corrosion may well be controlled, also by the higher resistivity values and the improved microstructure which will limit ingress of oxygen and water. This needs to be considered in future research on reinforcement corrosion characteristics of LC3 concrete. Bulk diffusion resultsFigure 6 shows the measured chloride profiles of the concrete specimens with 0.4 w/b ratio. The resulting estimated chloride surface concentrations (Cs) and apparent diffusion coefficients (Da) are discussed in [22]. The LC3 mixes, regardless of clinker content and type of clay, have lower Cs-val0,00,20,40,60,81,0R-mixes LC3-45 mixes LC3-55 mixes LC3-65 mixesk (x 10-11 m/s)R1R2B-ClayH-ClayPH-Clay10,010,210,410,610,811,011,211,411,611,812,0R-mixes LC3-45 mixes LC3-55 mixes LC3-65 mixesOPI (Log scale)R1R2B-ClayH-ClayPH-Clay0,00,20,40,6R-mixes LC3-45 mixes LC3-55 mixes LC3-65 mixesk (x 10-11 mR2B-ClayH-ClayPH-Clay10,010,210,410,610,811,011,211,411,611,812,0R-mixes LC3-45 mixes LC3-55 mixes LC3-65 mixesOPI (Log scale)R1R2B-ClayH-ClayPH-Clay5,05,56,06,57,07,58,0R-mixes LC3-45 mixes LC3-55 mixes LC3-65 mixesWSI (mm/hr0.5)R1R2B-ClayH-ClayPH-Clay2,03,04,05,06,07,0R-mixes LC3-45 mixes LC3-55 mixes LC3-65 mixesPorosity (%)R1R2B-ClayH-ClayPH-ClayFig. 1: Permeability coefficients (a) and corresponding OPI values (b).Fig. 2: Water sorptivity results of LC3 and reference concrete specimens.Fig. 3: Porosity of the concrete specimens.a) b)0,40,050,150,250,350,450,550,65R-mixes LC3-45 mixes LC3-55 mixes LC3-65 mixesCCI (mS/cm)R1R2B-ClayH-ClayPH-ClayFig. 4: Chloride conductivity index (CCI) results.
